

Letter no. 6: Heading toward new highs

Date: 15/10/21 Current BTC Price: 59.5k
Hey Subscribers,
Welcome to letter no.6 of Dor’s On-chain Newsletter.
In my last letter I analyzed the on-chain data from different angles which all seemed healthy & positive. I sticked to the thesis that bitcoin is supposed to continue higher and so it did. Since then bitcoin’s price broke key resistance areas and has steadily continued higher to the 59.5k level.
In this letter I’ll continue to assess where price is likely heading in the coming weeks & months. I’ll introduce a new metric I came up with using Glassnode Workbench tool and look at a few different on-chain categories.

Key Takeaways
Realized Price-to-Liveliness Ratio signaling for a continuation of macro uptrend.
Bitcoin Realized Volume Profile signaling for last resistance levels to be broken before heading for another ATH.
aSOPR trending up and at minimal levels as compared to the last bull run.
Realized Cap HODL Waves suggests that we’re at stages of accumulation / pre-macro uptrend.
Spent Output Age Bands suggests that the main part of profit taking comes from short-term holders.
Bitcoin’s RVT ratio is signaling an increasing on-chain activity which brings along macro uptrend.
Analysis Breakdown
I’ll start off this letter introducing new metric I created called Realized Price-to-Liveliness ratio which is consisted by two heavy macro metrics.
A proper explanation post about the metric have been posted earlier today in this newsletter.
The metric compares the spending / HODLing behavior of long-term investors (Liveliness) with the ‘fair value’ of bitcoin (Realized Price).
Simply put, it measures the cost basis of bitcoin (value realized on-chain) by the coin-days destroyed (energy expended to attain that value).

The metric is a relative of Realized Price and behaves similarly, but it helps to navigate the market better and provides additional and necessary indictions as; macro trends support & resistance areas, early bear market signals and bull market confirmations.
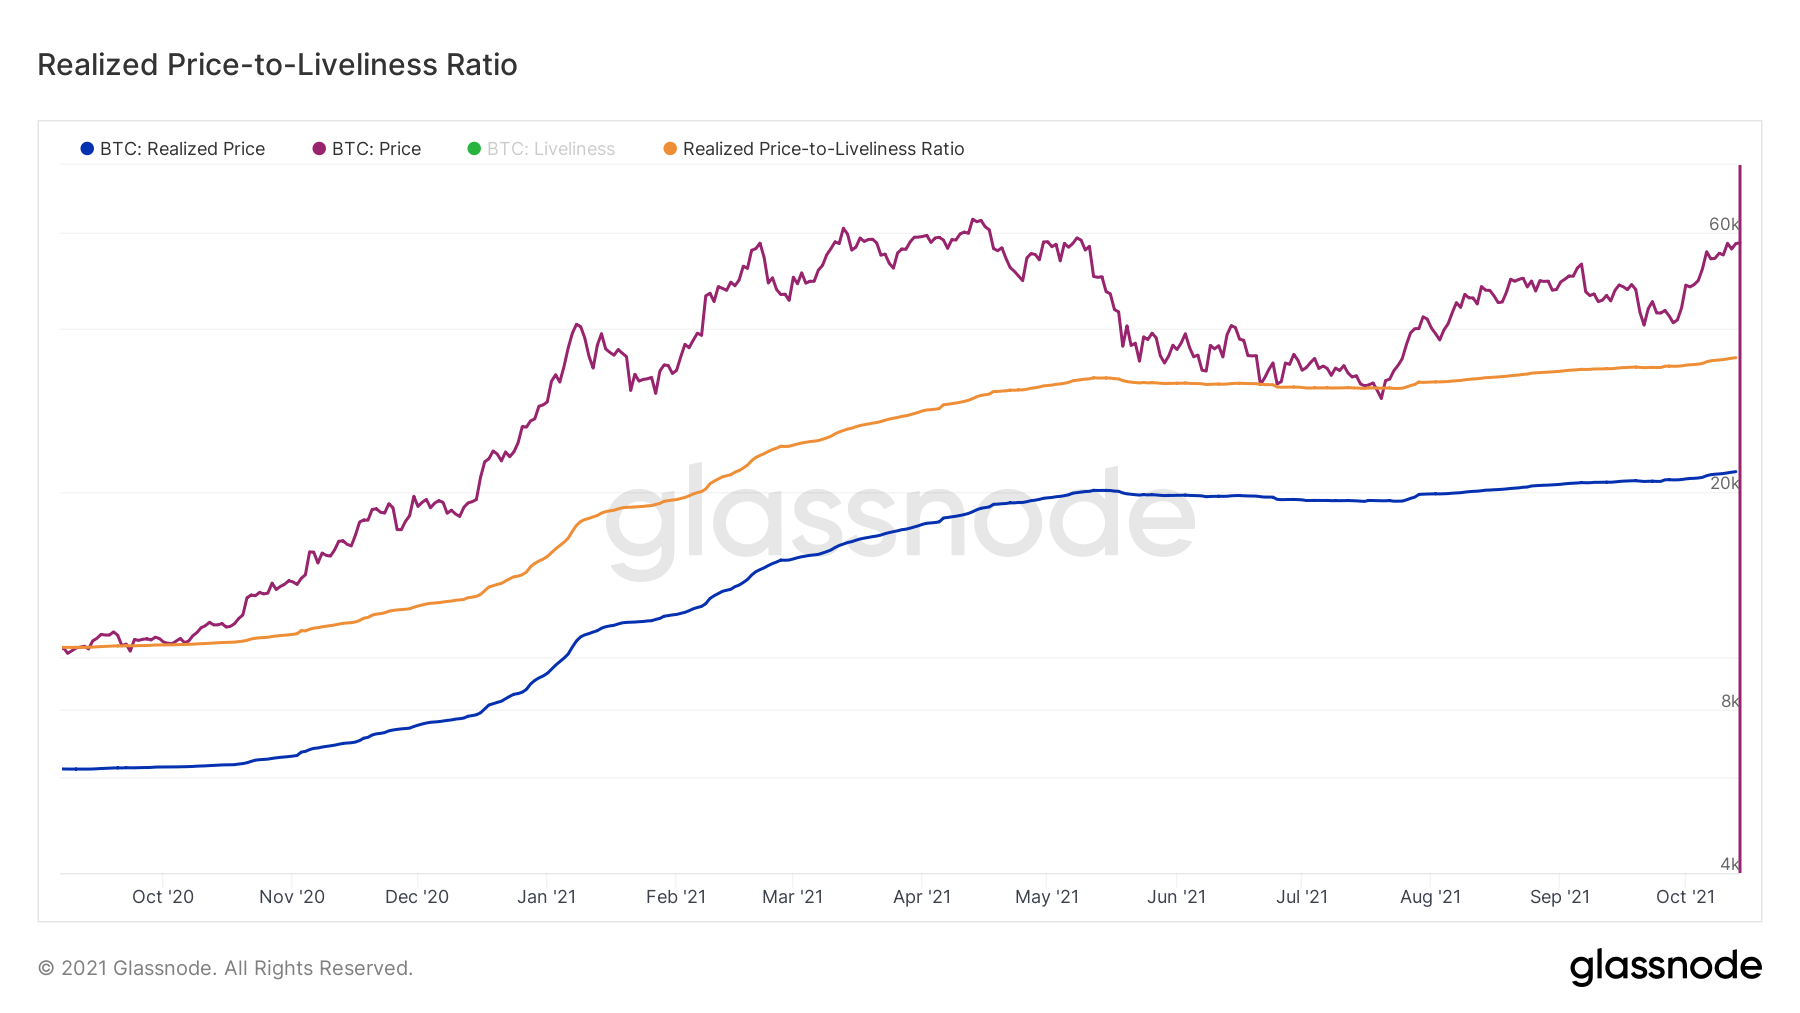
Price successfully bounced off it’s support area in the last capitulation event, this is a positive and healthy signal that we’re not in a bear market and the macro trend is probably heading higher.
Returning to metric I touched on in letter no. 4 which called Bitcoin Realized Volume Profile, since the last time I covered it price has successfully passed a few resistance areas.

Currently it’s in the final stretch, needs to break the 60k resistance if it manages to do so it will reach thin air territory which will increase the probability to touch the previous ATH, break it, and get in price discovery mode.
Returning the stage to aSOPR which captures the aggregate profit and loss by market participants at a specific time-frame.

The metric has steadily bounced off level 1, which is a phenomenon typical to bull market corrections. Moreover, if price trending up along with the metric it indicates that there is sufficient demand to absorb the sold coins.
Lastly, we can see at how minimal levels the metric is as compared to the last bullish rally. This is a signal that exploring new highs is ahead of us.
We all already know the importance of long-term hodlers behavior which set the trajectory of the long-term trend. But we surely should not forget the short-term market participants. They’re the most reactive to the short-term price movements and therefore it’s worth following their spending behavior.

Looking at Realized Cap HODL Waves while enabling only the short-term age clusters, we can see that the supply they’re holding is at levels that historically indicated stages of accumulation / pre-macro uptrend.
Continuing with Net Realized Profit/Loss metric, in the last couple weeks we have seen an uptrending profit taking. This is a normal phenomenon in bull markets; as price heads higher market participants have higher incentive to realize profits.
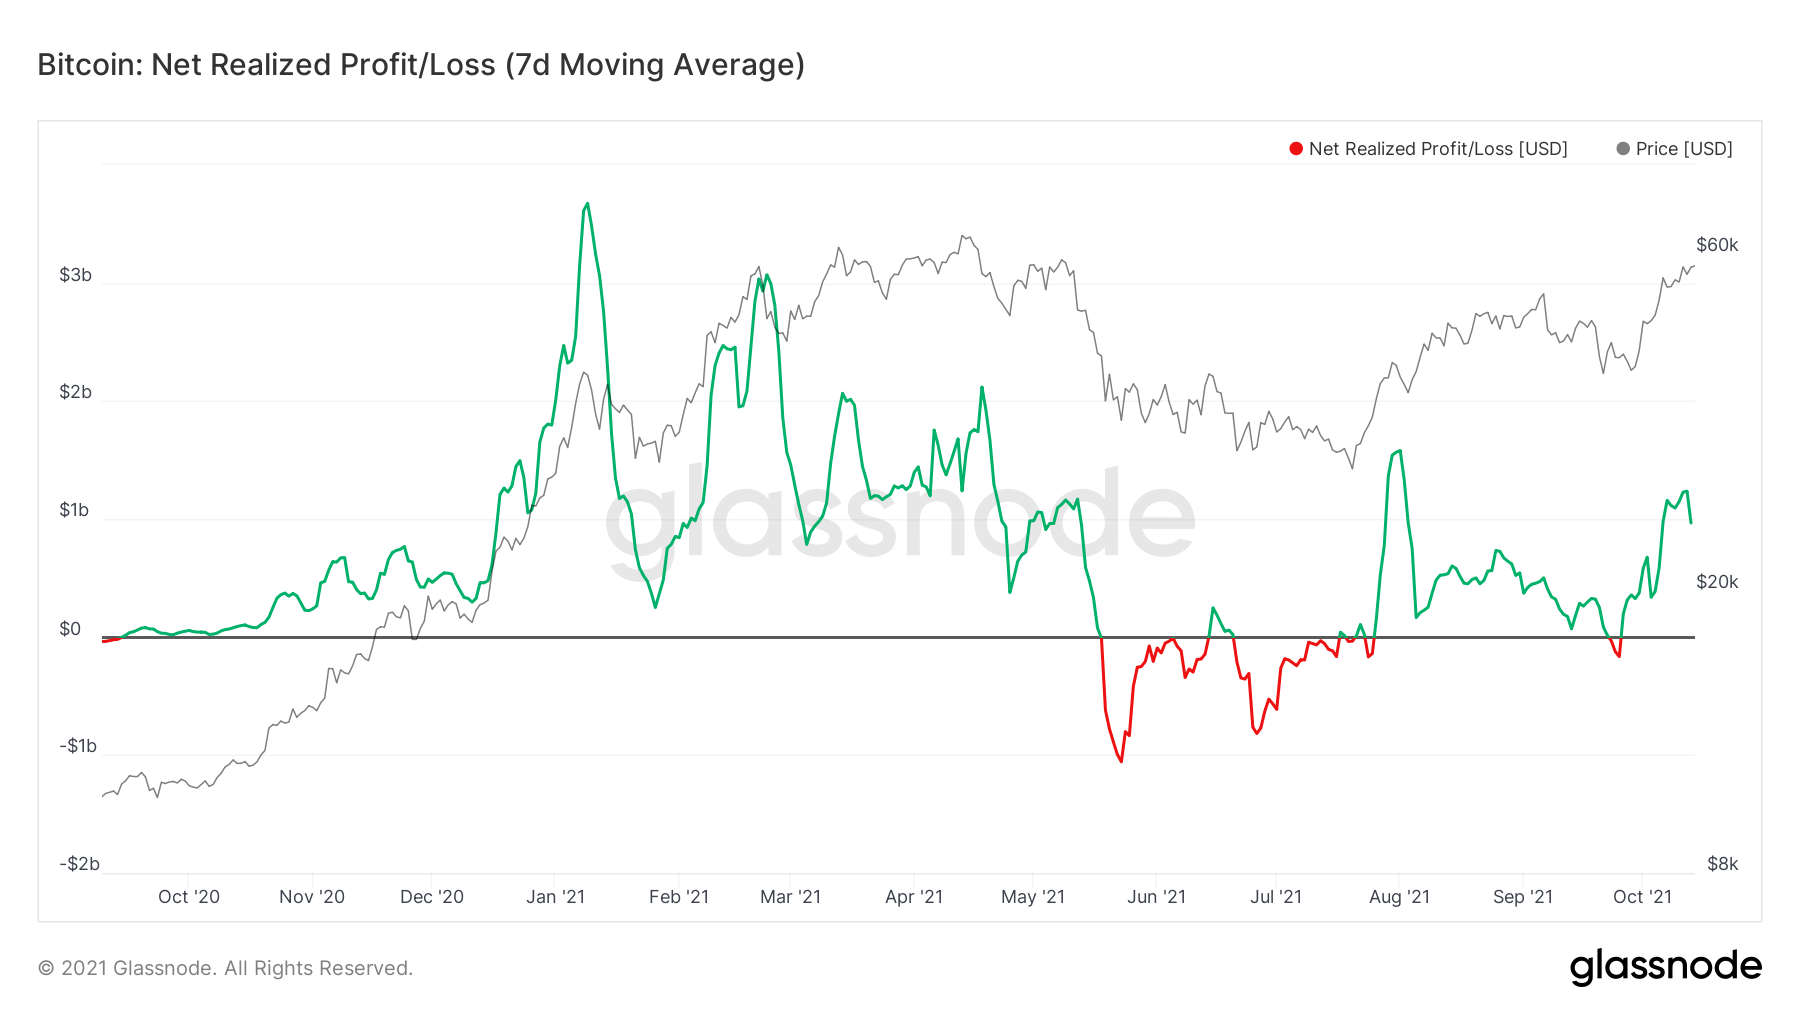
What is important to focus on is whether the market has the ability to absorb those sold coins - it does because simultaneously price continues to head higher.
And who is distributing coins to the liquid supply, let’s look at Spent Output Age Bands to give us an answer.

The chart above shows that STH (short-term holders) counts for 33% out of 41% spent outputs, while LTH (long-term holders) are counting for only 8%. STH are spending 4 times more than LTH, and this is an indication that the selling comes mainly from the STH group.
I’ll round off this letter looking at bitcoin’s RVT ratio, which is realized cap/transaction value and is used to compare the utility of the network (value transacted) to the value stored in the network (Realized Cap).

Every time RVT went below 30 level it signaled an increasing on-chain activity which brought with it a macro uptrend, not long ago the metric crossed below the 30 level.
This is another bullish indication to the already many which suggests that a macro uptrend is around the corner.
Conclusions
So far so good, on-chain remains healthy and provides a more accurate indications which suggests an upcoming bullish rally. I do expect a new ATH in the upcoming couple of weeks which will bring along a multi-month macro uptrend into 2022.
Link the references
Newsletter Archives: Dor’s On-chain Newsletter
Data Sources: Glassnode, Checkonchain.com
Disclaimer
Nothing written in this newsletter is to be considered as an investment / trading advice, do your own research.
If you found this letter helpful and informative I’d appreciate your subscribe and share, this way I will be able to reach more people.