

Letter no. 4: Crab-Walking

Hey subscribers,
Welcome to letter no.4 of Dor’s On-Chain Newsletter.
In my last letter I wrote about three important on-chain categories to take a look at, at times like this of consolidation / downtrend. Bitcoin then saw a sharp downtrend affected by macro parameters. I analyzed the on-chain data and closed the letter with a conclusion of still healthy on-chain fundamentals.
In this letter I will further explore the on-chain data, see if anything has changed for better or worst and take a look at the broader macro situation.
Key Takeaways
Entering higher prices cluster; heading towards stronger resistances along with a potential price increase if they’re broken.
Some profit and losses have been taken, aSOPR at a slight uptrend; in hope for bouncing off level 1 which would be bullish if it happens.
Macro momentum is continuing to reverse to the positive side, signaling for strengthening macro momentum.
Long-term HODLers did some profit-taking, but they’re still mainly HODLing.
Macro: We’re at neutral area, expecting price to hold BPT2 support level and continue higher.
On-chain Analysis
Looking at Bitcoin’s price we can see that it’s continuing to consolidate, actually crab-walking in the low to the mid-high forties. At the time of writing we’re experiencing a 8 percent move to the upside, pushing price to the 47k area caused by short liquidations.

I’ll start off this analysis with Bitcoin’s Realized Volume Profile, which shows the amount of BTC transacted in USD in a specific price. Prices with high volume are prices that investors and traders found important and therefore act as support / resistance levels.
Just now we reached 47k area which means we have passed a decent resistance price - 46.5k level.
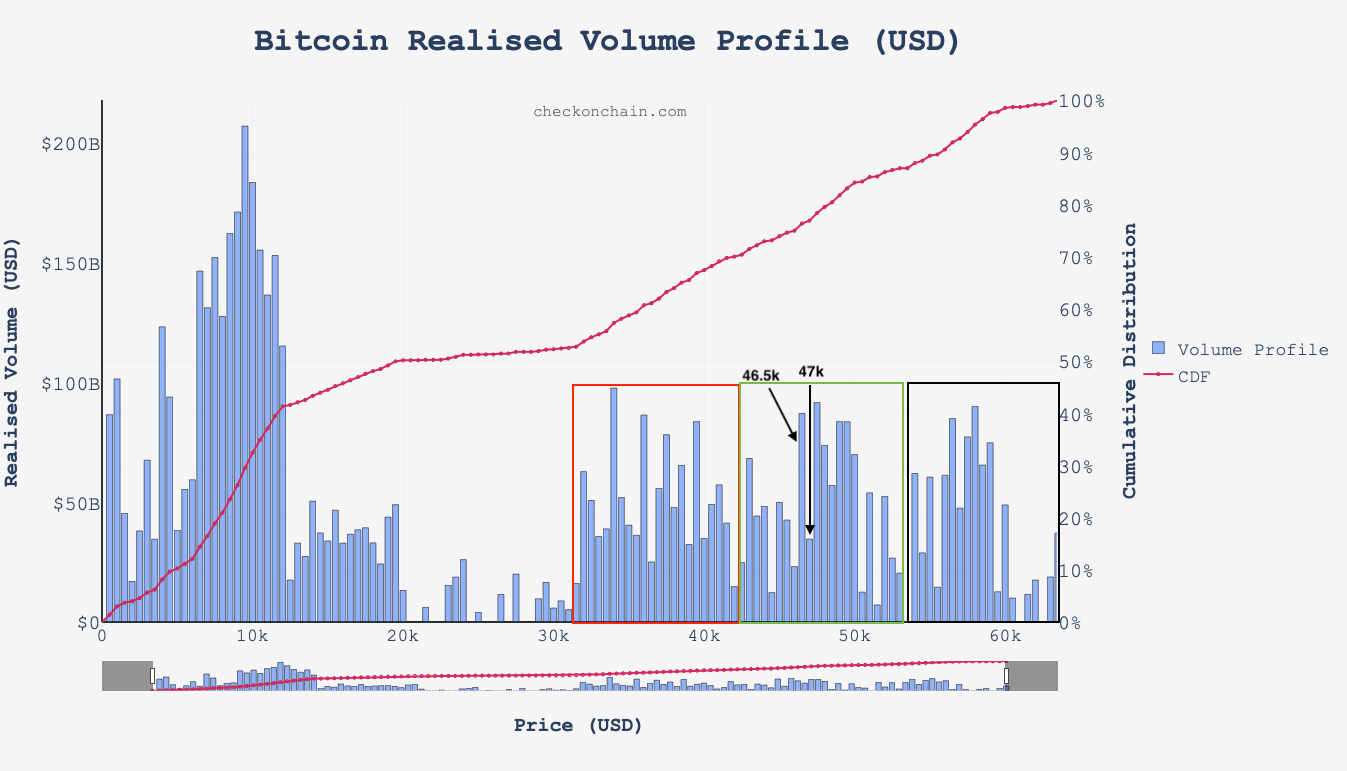
Moreover, being in a cluster of higher prices along with breaking a price level with high volume are bullish signals. We’d want to continue break resistances, especially the strong ones with high volumes to confirm a strengthening of momentum and higher probabilities of price increase.
Giving the stage to aSOPR, we can see that there have been some profit taking along with some losses taken too. The metric is slightly trending up, dancing around level 1.

We’d want to see aSOPR bouncing off level 1, continuing higher. Otherwise it would mean that investors are capitulating, accepting the situation and impatiently realizing losses. Losses being realized is not common in bull markets due to expectation of price increase. So, a continuation to the downside would be bearish.
Macro momentum check, looking at Bitcoin 140-day Market-Realised Gradient Oscillator. Momentum is continuing to reverse from the negative area to the positive, doing so slowly but surely.

Historically, once the metric crossed to the positive momentum side we saw a macro uptrend. Seems like we have some time until the cross to the positive side will happen, this probably will give time to the last stages of accumulation before the next run up.
Checking up long-term HODLers, we can see the their supply in profit is mainly in an uptrend, although we saw some spending lately.

Unless we see massive downtrend in their supply in profit; which means they’re distributing coins, I would not be worried.
As a complementary metric we’ll look at the cohort of coins spent to assess which long-term HODLers have sold coins.

Spending came from 6m-1yr and 1y-2t, but at minimal levels which indicates that HODL sentiment is still strong. Sustaining these levels is okay, we would not want to see increased spending from these market participants.
I’ll close this letter with a metric which will give us a glance at bitcoin’s macro situation. I will look at Bitcoin Price Temperature Bands which simply measures the distance between bitcoin’s price to it’s 4-yr MA. Where the blue line (BPT0) is the 4-yr MA.
The more far away BTC from it’s 4-yr the higher the BPT level. Currently, we’re at BPT2 and we’d want to hold this line as support. According to the metric it seems that we’re in middle, almost 50% bullish and 50% bearish.

Due to healthy on-chain data in my opinion we’re more likely to hold BPT2 area as support and head higher to the hotter temperature bands which will signal for an upcoming macro top.
Conclusions
On-chain data barely changed, HODL sentiment still around, along with continuation of supply shortage. Volatility is still expected along with a period of downtrend / consolidation which will allow the last stages of accumulation into late 2021. This, will set the stage for the next rally around the end of 2021 to early 2022.
Disclaimer
Nothing written in this newsletter is to be considered as an investment / trading advice, do your own research.
If you found this letter helpful and informative I’d appreciate your subscribe and share this way I’ll be able to reach more people.