

Letter no. 5: Breaking Ceilings

Date: 06/10/21 Current BTC price: 54.7k
Hey subscribers,
Welcome to letter no.5 of Dor’s On-chain Newsletter.
In my last letter I continued to outline a bullish on-chain fundamentals with expectation to head higher, as mentioned in letter no.3 too - that have been successfully predicted. Since then, bitcoin continued to break price ceilings one after another, moving from 47k to 54k and showing strength.
In this letter I will continue to explore and analyze the on-chain data from different angles, to see if the price increase is continuing to be supported by strong and healthy on-chain fundamentals.

Key Takeaways
Supply held by LTH is at ATH according to HODL Waves; strong HODL sentiment, signaling price increase ahead.
Realized Cap is at a phase which historically signaled a pre-bull run stage.
Exchange Supply Shock is healthy, coins are still moving off exchanges.
RPV metric indicating that BTC is probably in a transition phase from bear to bull market.
BTC bouncing off NUPL 0.5 level - historical critical support area.
BTC denoted stablecoins of sideline investors are starting to flow back into BTC.
On-chain Analysis
Bitcoin’s price continuing to head higher doing so with strong daily candles. Seems that price action is gaining momentum to the upside as more and more market participants starting to realize that we’re not heading lower to another protracted bear session and are convinced to buy in in order to not miss the upcoming rally. Moreover, supply squeeze starting to affect price in a more noticeable and aggressive way.
Let’s dive in and see what the on-chain data can tell us.
Starting off with HODL Waves, a metric that will help us assess the condition of coin maturation; the willingness of HODLers to continue and HODL.
Currently, long-term hodlers hold around 85% of coins in supply which means that coins held by LTH has reached it’s all-time-high. This means that although price is increasing, long-term hodlers are not willing to sell their coins. Their conviction to HODL is staying strong, this suggests that price increase is ahead of us.

It is when they start distributing coins which will give the indication of the beginning of the next rally.
Taking a look at Realized Cap, which calculates investors cost basis by valuing only the active coins at the price they are last moved. We can see that lately realized cap started to increase in a slight angle; it is a signal that we’re setting up for the next rally.

For a more clear view of the trend.

Continuing with Exchange Supply Shock, which tracks the demand and supply via speculative coins on exchanges vs investors coins held in cold-wallets. Lately, it’s been increasing at an accelerating rate; probably long-term hodlers took advantage of price corrections to strengthen their BTC position. Probably knowing that there is a macro uptrend ahead of us.
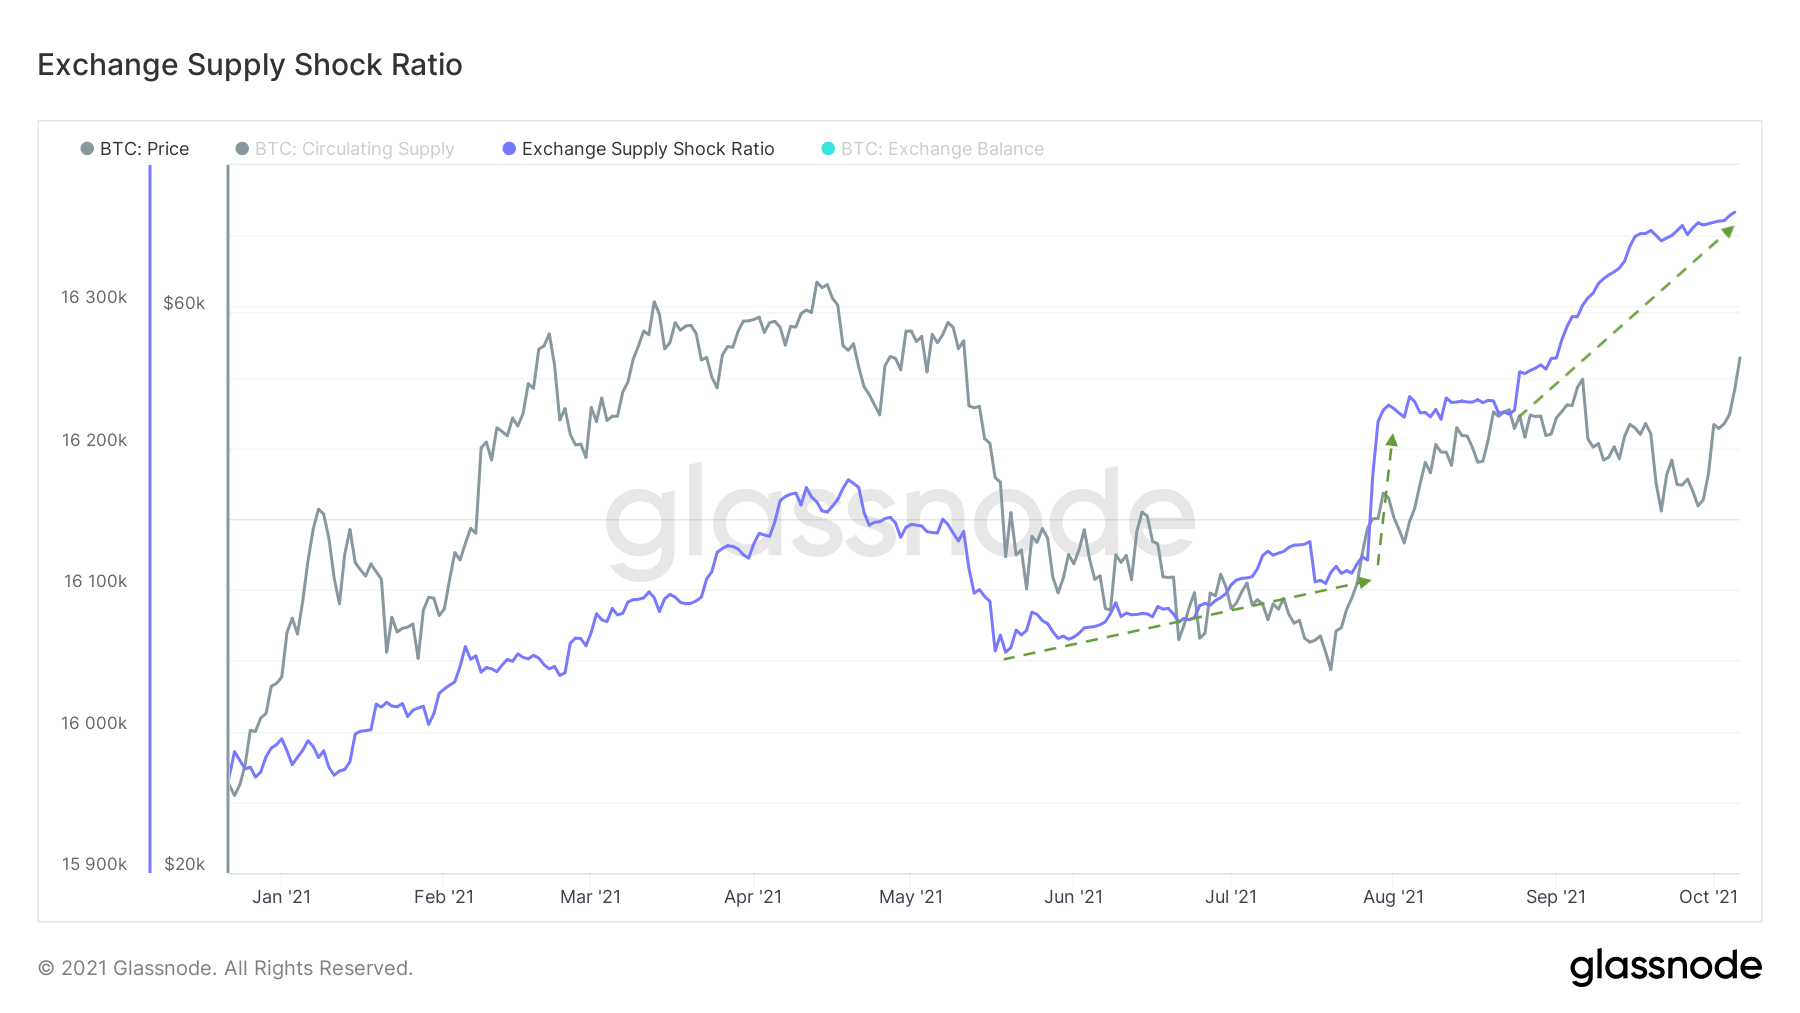
We can say for sure that exchanges experiencing supply shock is affecting price positively.
Another angle to see the relationship of investors with exchanges is to look at Exchange Fee Dominance.
Since the end of the May sell-off, withdrawals fees dominance has increased parabolically.

This indicates that market participants are taking coins off exchanges, due to belief that a macro uptrend is upcoming and the best decision is to hold coins in cold-wallets for long-term HODL.
Glassnode’s new metric, Realized Profits-to-Value (RPV) is a ratio between Realized Profit and Realized Cap. Simply, it compares the market’s profit taking with it’s overall cost basis (Realized Cap).
Currently the metric is at what I call a ‘Transition Range’, which historically indicated a transition from bear to bull market and vise-versa.
Once the metric broke above or touched the lower dashed line after a downtrend and continued to the upper dashed line, it was a signal for an upcoming uptrend / confirmation of an uptrend.

Clearly, not long ago we touched the lower dashed line, so far we continuing higher. Breaking above the upper line will strengthen the indiction for a continuation of an uptrend.
Moving on to NUPL, a spending behavior metric which is the difference between relative unrealized profit and relative unrealized loss. Lately we bounced off an important historical support area - 0.5 level, holding it is a positive sign.

This signals that over 50% of BTC’s network participants are in net profit. Historically, the 0.5 - 0.75 range is where BTC’s most aggressive upward moves happened.
Lastly, Stable Coin Supply Ratio which is the ratio between Bitcoin supply and the supply of stablecoins denoted in BTC.
While this metric is trending up it means that investors who sat on the sidelines are resuming to buy bitcoin with their stablecoins.

Even the skeptical Bitcoin investors are returning to buy. And if compared to March - April ATH, we can see that there is a lot more gunpowder to shoot the price higher.
Most be noted that the only concern is on-chain transactional activity, it is not picking up - active addresses is not recovering properly and the mempool is still empty. It’s negative interpretation is low interest in the network and unwillingness to use it, but it’s counter positive interpretation is that speculative market participants are gone (less volume due to less traders and speculators) and coins are mainly dormant, HODLed and not transacted (not sold).
Conclusions
So as for now, on-chain data seems healthy and positive from most angles, therefore I do expect a continuation to higher levels in the coming weeks, with the 56k - 59k being the strong resistance areas that most be broken to continue higher.
Disclaimer
Nothing written in this newsletter is to be considered as an investment / trading advice, do your own research.
If you found this letter helpful and informative I’d appreciate your subscribe and share, this way I will be able to reach more people.