

Letter no. 9: Slowly But Surely

Date: 4/11/2021 Current BTC Price: 61.2k
Hey Subscribers,
Welcome to letter no. 9 of Dor’s On-chain Analysis Newsletter.
In my last letter I wrote about the fact although price has decreased on-chain fundamentals have stayed healthy and are typical to a pre / beginning of a macro up trend. I also mentioned that I expect an upcoming leverage wipe-out, which have not happened yet, at least not enough to enable a healthy price increase. Since last week BTC’s price has trended up slightly from 61k to 62.1k and at the time of writing is heading back to the 61k level.

Analysis Breakdown
I’ll start off this letter with a very important metric I always keep a close eye on, which is LTH Supply. I’ve covered it in the two last letters. In letter no.8 more specifically, we got an indication that LTHs are back in accumulation this was provided by a slight uptrend in the supply they’re holding.

This has reversed in the last days, where LTH sold around 76k BTC from the last peak. This, in my opinion, is a more clear indication of a peak accumulation and the beginning distribution by LTHs. Which as I’ve mentioned in the past have is indicating the beginning of a macro uptrend.
The decrease in LTH supply can also be seen looking at LTH Net Position Change, which measures the monthly position change of long term hodlers.

Must be noted that, we’re still very far from peak distribution which indicates the coming of a macro top.
Back to our dear friend - aSOPR which is the profits / losses taken in a specific time frame. It’s has reseted once again, touching level 1 and bouncing back up, it means that investors are reaching break-even point (level 1) and are not willing to realize profits. This probability due to expectation of an upcoming price increase.

Moreover, price has maintained it’s levels while profits has been taken, and it’s indicative that there is still sufficient demand to absorb the sold coins.
Continuing with Entity-Adjusted LTH NUPL, which is the net unrealized profit/losses of LTH, discarded of transactions between addresses of the same entity.
We can see that 0.75 have been historically a key resistance that needed to be broken for price to go into a macro parabolic action.

In a more specific view, we can see that it rejected twice by the 0.75 level, as mentioned this is a key resistance to keep an eye on and expected to be broken and provide another indication which will confirm the beginning of a macro uptrend.

A field that I have lately started to broaden my knowledge in is the derivative markets, so I’ll touch it in a more deep way.
In the last couple of weeks price mainly have consolidated while funding rates have stayed at high levels & increased. High funding can be bearish if new longs enter the market (open interest increase) but price moves sideways / down.
This causes the cost of being long eating into margin while profits are not covering the cost of being long (not paying for funding rates).

This comes along with a still high, but consolidating open interest which means that there is high interest in going long. But we do have a general decrease in OI which means that some longs have been closed and some leverage has left the market.

A more general positive note is that Crypto-Margined has decreased significantly from the highs of April. This is a more healthy leverage due to the fact that traders are using more stablecoins and USD as collateral which is a stable collateral that has less probability of causing long liquidations.
As opposed to BTC which is more volatile and has higher probability of causing long liquidations. This because price decrease drawsdown the value of the underlying collateral (BTC).
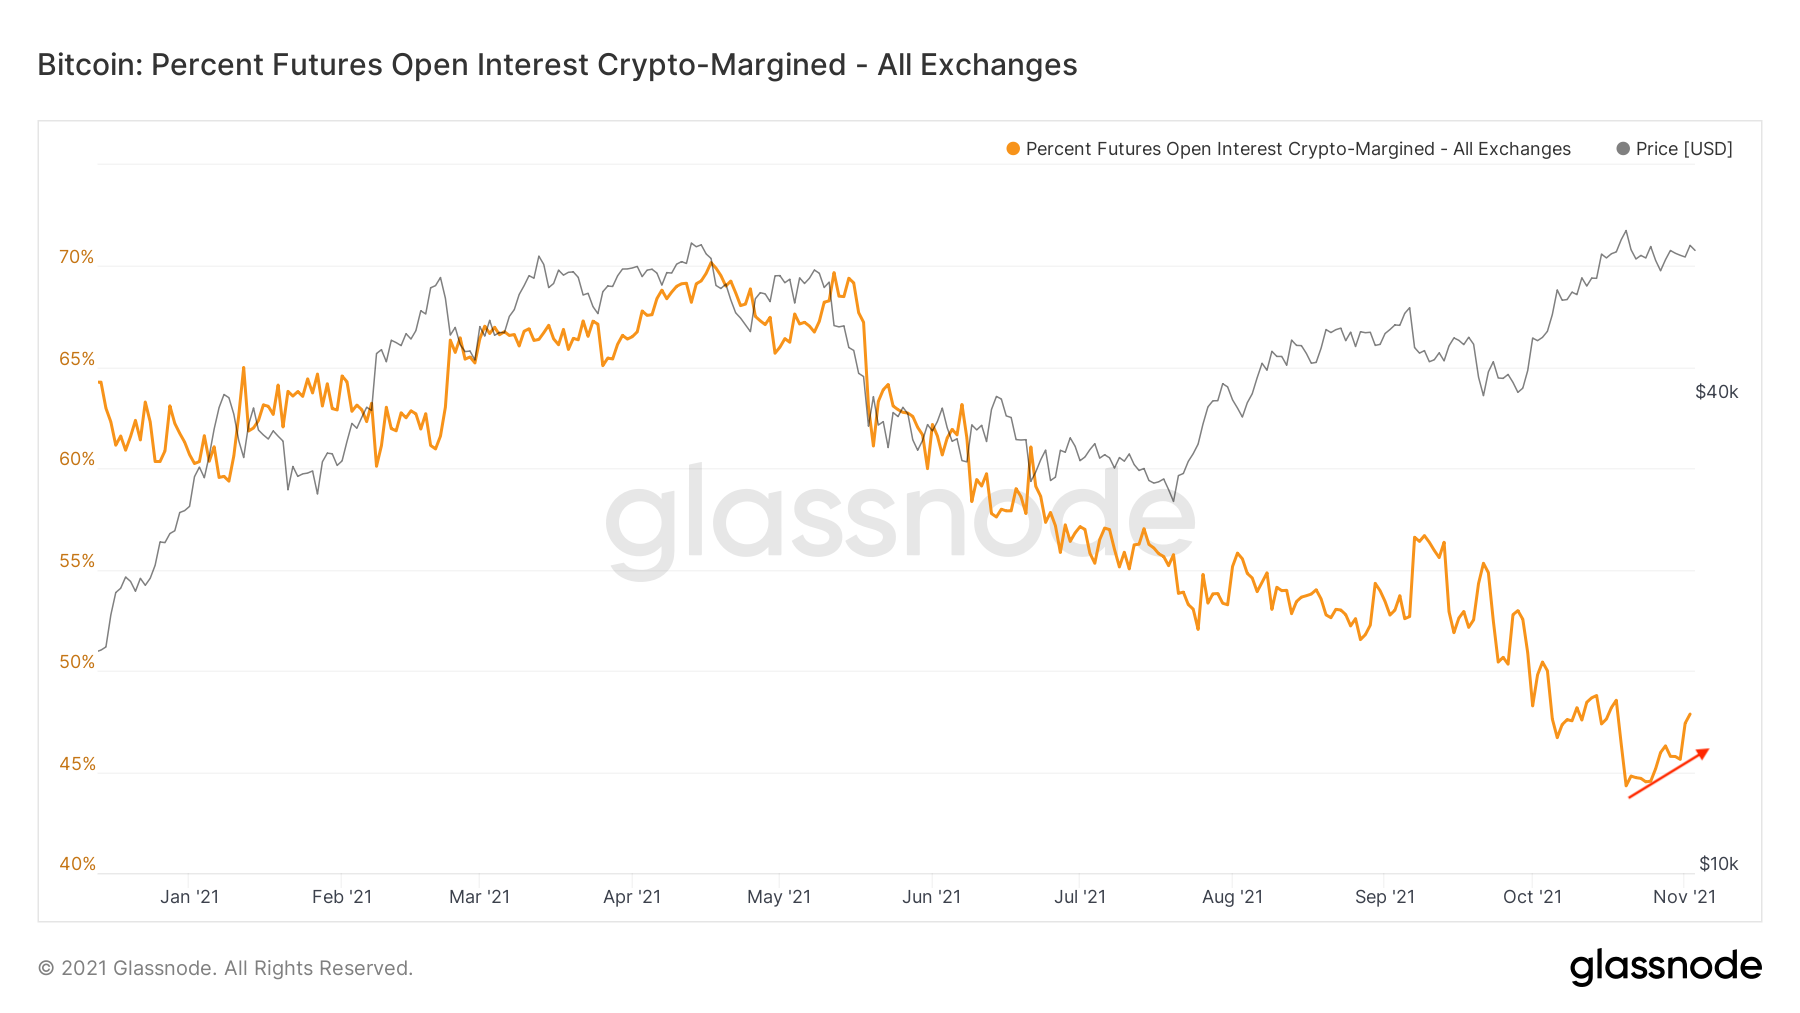
Although crypto-margined has increased lately it’s not something I would be worry about, at least not at these levels.
So, overall derivative markets is neutral, but a lower funding rates and OI is expected in order to allow a healthy spot-driven price increase.
I’ll round up this letter with a macro view, looking at Mayer Multiple provided Glassnode’s Workbench Tool. Simply, MM is an oscillator that measures the distance of price from it’s 200DMA, which is a moving average indicative of macro bull or bear markets.
As the chart shows, we’re currently at a relatively low values, which historically has been indicative of a pre / beginning of macro up trend.

Albeit in the short-term we might see some volatility and downtrends. I’m quite sure that the macro view is very healthy and the upcoming months are going to take us to new highs.
Conclusions
So far things are playing well; LTH are signaling for peak accumulation into distribution, still sufficient demand to absorb sold coins, BTC-margined is at relatively very low levels which lowers the probability of long liquidations and key macro metric - Mayer Multiple is signaling for an early bull runs stages.
Considering the above information, I do stick to my thesis that in the upcoming months we will see new highs and another macro top. Still reminding that although healthier, but there is still leverage in the market that can affect price down in the short-term.
In the coming weeks I do expect a gradual decrease in leverage to a more normal levels and a healthier price increase which will bring us to new highs.
Links and References
Newsletter Archives: Dor’s On-chain Newsletter
Data Sources: Glassnode (T3 paid subscription)
Disclaimer
Nothing written in this newsletter is to be considered as an investment / trading advice, do your own research.
If you found this letter helpful and informative I’d appreciate your subscribe and share, this way I will be able to reach more people.