

Letter no. 8: The Final Stretch

Date: 28/10/21 Current BTC Price: 61.5k
Hey Subscribers,
Welcome to letter no. 8 Dor’s On-chain Newsletter.
In my last letter I wrote about the new all-time-high and how it sits in the macro picture of Bitcoin’s market structure. I did also mentioned that a short-term downside price action is possible due to leverage in the market. Predicted right, in the last week we saw a downside price action as bitcoin is diving back from 66k to 59k and at the time of writing it’s heading back up to 61.5k level. It seems like Bitcoin is in it’s final stretch before returning to price discovery mode.
In this letter I’ll focus on the behavior of long-term hodlers, coins lifespan and supply dynamics to assess how these on-chain categories are reacting to the downside price action and whether it changes the big picture.

Analysis Breakdown
I’ll start off with UTXO Realized Price Distribution to assess our upcoming resistance area and what is the likelihood to break it and return to price discovery mode.

As the chart shows, price is in it’s final stretch, just needs to break the 62.8k resistance area where 1.22% of BTC’s supply transacted (relatively weak resistance). If managed to do so and it will probably will, it’ll arrive at an easy resistance levels where only 0.88% of bitcoin’s supply moved which will provide a high probability of continuing higher.
In the last letter I covered that LTH started to distribute coins which indicated for a beginning of a macro uptrend. In the last week this have reversed, seems like LTH are taking advantage of the last downside price action to continue their accumulation.

This is a positive indication, suggesting LTH continuing their accumulation in expectation for price increase.
Looking at LTH SOPR can give us an indication to the incentive of LTH to realize profits. In March-April ATH LTH have realized gains of 700% - 900%, currently they’re realizing profits of around 200%.

The fact that LTH are incentivized to sell coins after price multiplied itself by 5-9 from their buying price is another indication that an upcoming macro uptrend in coming. BTC’s price will need to go up a few more multiples for LTH to be incentivized to realize profits at increasing rate.
Although LTH are continuing their accumulation, we did saw some profit taking from coins with age of 3m - 1y. Mainly from 6m - 1y coins, these are probably coins that has been bought at the highs of April - May which reached break-even point and realizing profits. But that, older coins are pretty dormant with minimal spending.

Another interesting lifespan metric is Dormancy adjusted for entities, which is the average number of days destroyed per coins transacted.
We can see clearly that the metric is still at minimal levels in comparison to those of March-April ATHs. In a more specific view, the metric’s current values are at pre-bull run levels.
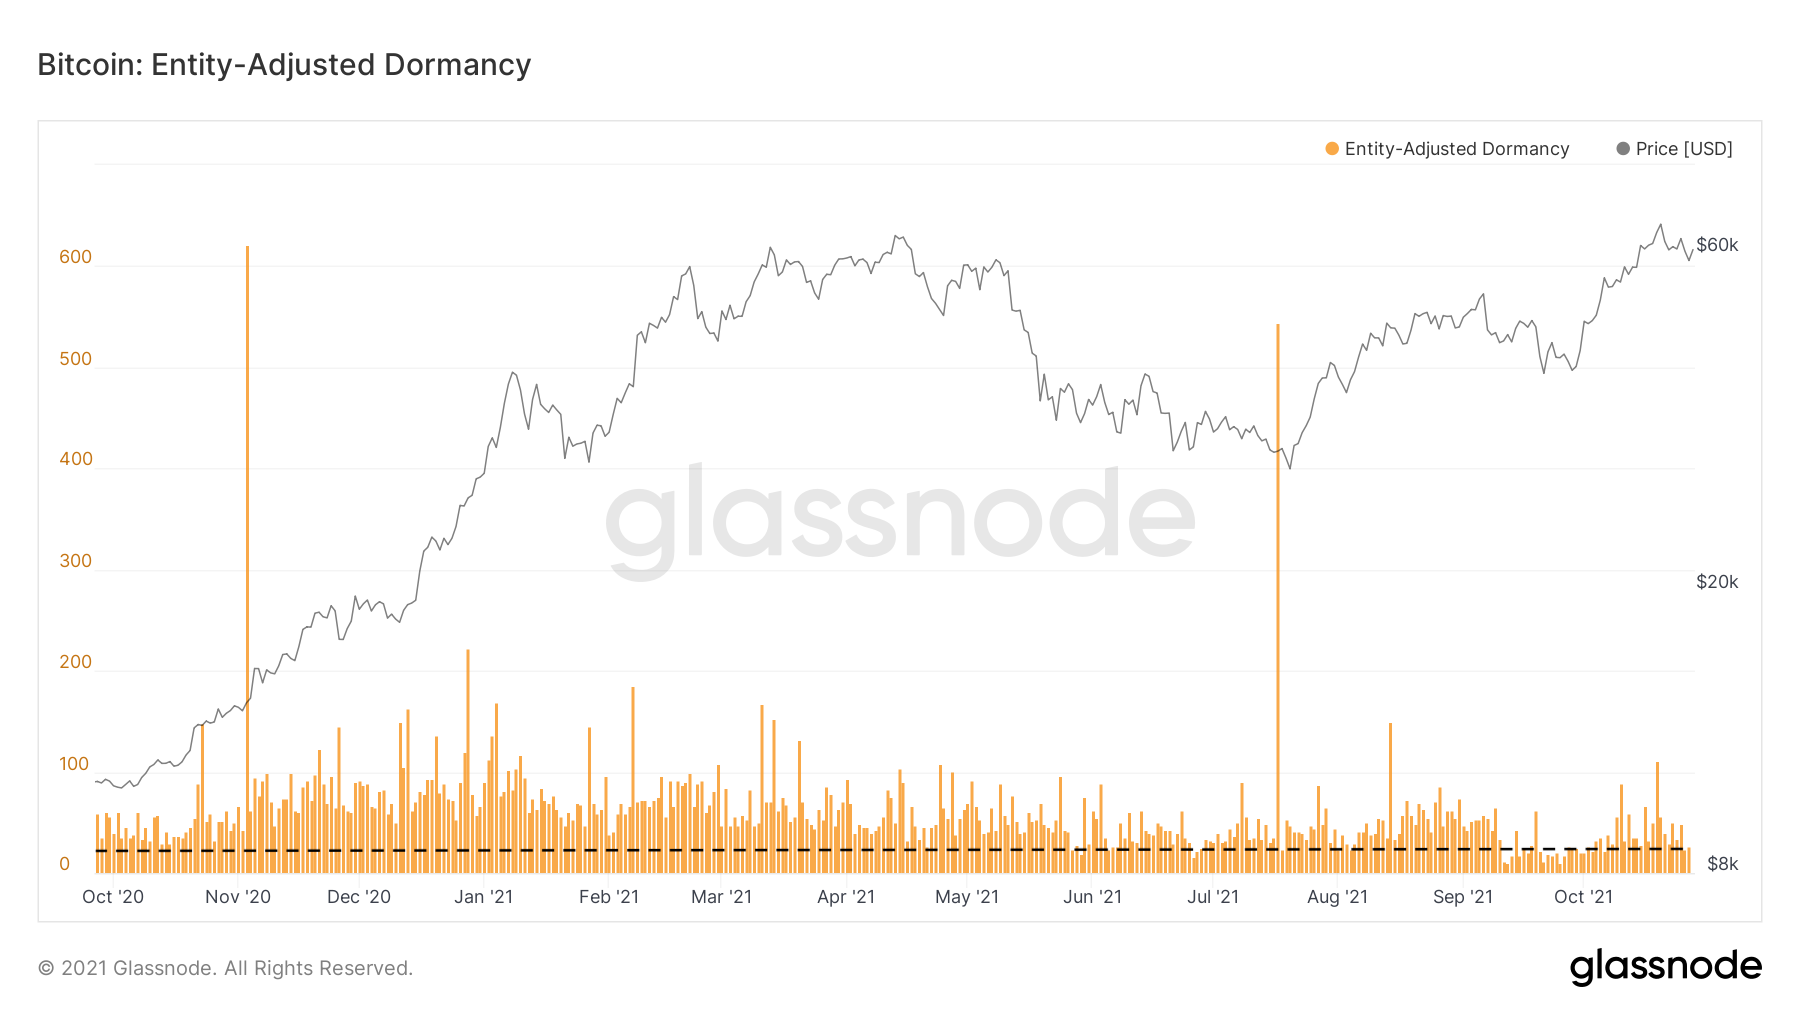
This is indicative that market participants are not satisfied with the current prices as an incentive to depart from their coins. Therefore, waiting for higher prices to do so.
Giving the stage to Illiquid Supply Shock which is a supply related metric created by Will Clemente. It’s the ratio between Illiquid Supply (supply held by entities with strong inclination to HODL) and the sum of Liquid and Highly Liquid Supply (held by short-term holder and speculators).
It provides an indication of a Supply Shock, which occurs due to fewer coins available relative to the demand.

The metric is continuing to trend higher, this means that more and more coins are moving to illiquid state, accelerating the probability of a supply shock which will bring higher prices. These coins will probably stay in illiquid state at least until we see higher prices.
Taking a more depth view of supply dynamics, we can see that supply revived within 1yr - 5yr + age cohorts is still low. Only 1+ year is at high levels which are still considered low relative to March-April ATHs. This demonstrates the existing potential for an uptrend.

Supply held in exchange is continuing to flow out, most likely to cold wallets for a long-term HODL. The chart below shows clearly that market participants took the opportunity to accumulate more coins.

A complementary metric is Will’s Exchange Supply Shock which is too in a slight uptrend, indicating that liquid coins are leaving exchanges.

This letter will not be complete without writing something about the ongoing leverage in the market. Futures perpetual funding rates are still at elevated levels, levels which once we met lead to long squeeze; where many leveraged long positions are liquidated and closed (sell orders) which affects price to the downside.

Although funding rates have decreased a little bit in the last couple of days, funding rate positive / increasing while price is decreasing is not an ideal situation.
Moreover, open interest still remains at ATHs levels, indicating that there is a lot of money flowing into futures. Same can be said about options.


The three above charts at elevated levels is a clear indication for potential short-term downtrend & cautious, especially to the short-term holders and speculators. For LTH it might be an opportunity to accumulate more at cheap prices before we’re returning higher.
Lastly, leverage should be wiped-out and reset for price to have a healthy spot-driven increase.
Conclusions
Although price has decreased in the last week, on-chain data regarding the important categories mentioned above stays as expected to this stage of pre / beginning of a macro uptrend. I do expect that in the upcoming week leverage will be wiped-out and followed by price heading back to it’s previous ATH and continuing higher.
Links and References
Newsletter Archives: Dor’s On-chain Newsletter
Data Sources: Glassnode (T3 paid subscription)
Disclaimer
Nothing written in this newsletter is to be considered as an investment / trading advice, do your own research.
If you found this letter helpful and informative I’d appreciate your subscribe and share, this way I will be able to reach more people.