

Letter no. 7: Price Discovery Mode

Date: 21/10/21 Current BTC Price: 65k
Hey Subscribers,
Welcome to letter no.7 of Dor’s On-chain Newsletter.
In my last letter I elaborated about more healthy & positive on-chain indications which suggested a new ATH coming. As I expected the ATH came a week plus minus after the last letter has been written. The ATH which occurred on the 20th of October elevated the price up to 67k and got BTC into price discovery mode. As of writing BTC is trending down to the 64k level probably to test the previous ATH as support.
In this letter I will analyze what new ATH means for BTC’s market and how it sits in the broader macro picture.

Analysis Breakdown
I will kick off this letter with a chart that has been starring in the newsletter’s last analyzes - Bitcoin Realised Volume Profile. The metric represents the on-chain volume profile across different pricing buckets. As noted in previous letters price has broken several key resistance areas and reached an all-time-high.

Since then price has returned back to 63-64k level probably to test the previous ATH as support. We’re can see clearly that there is almost little to no resistance ahead while there is a lot of support around the 54k - 59k areas.
Taking this into consideration, I’m quite sure that price will head higher and return to price discovery mode.
Distribution Time
Long-term holders are defined as spent outputs with lifespan of at least 155 days, they’re market participants who are less likely to sell their coins.
There is an interesting cyclical phenomenon regarding LTH coins distribution; they’re always the first to take profits and they do so near ATH and after it. Once they start distributing coins it’s a clear signal that a macro uptrend is beginning.
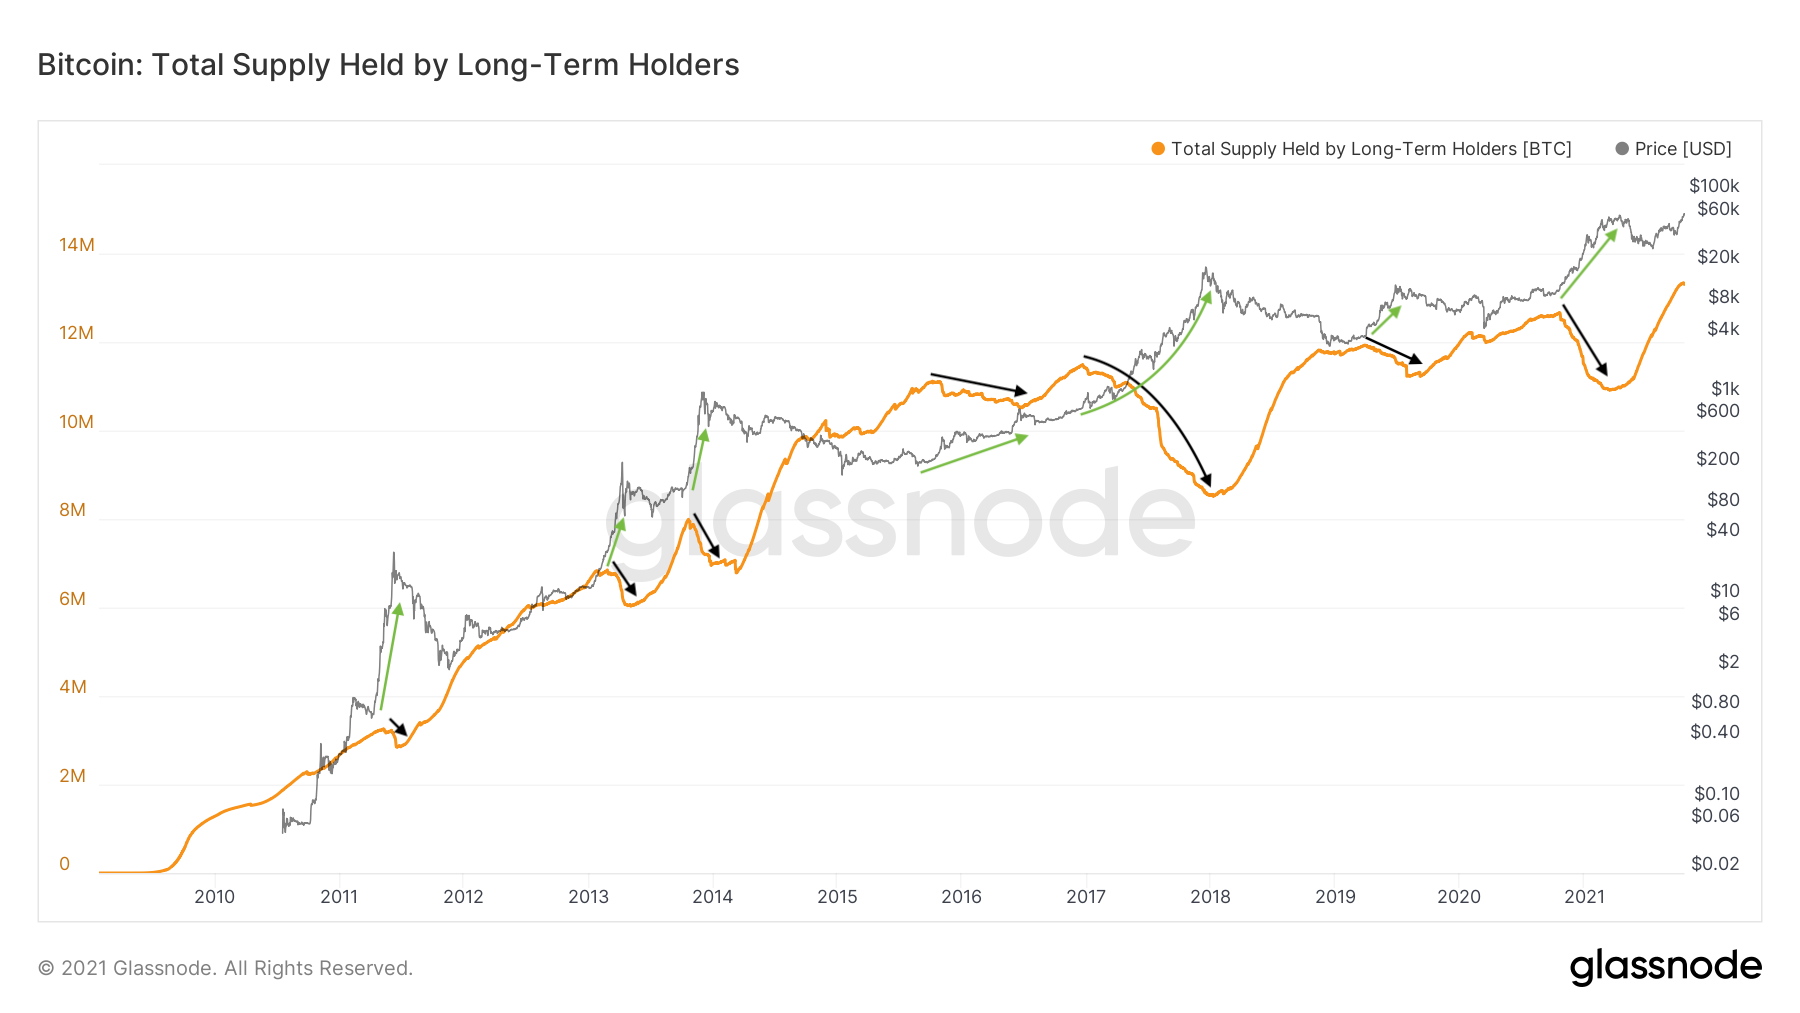
Taking a more focused view, we can see clearly that they’re returning to deplete their supply, as mentioned above, this signaling for an upcoming macro uptrend and we’re just at the beginning of it.

Another way to look at the coins distribution of experienced entities with long-term view is via Hodler Net Position Change, which shows the monthly position change of long term investors.

The chart above shows that the HODLing of long-term investors reached almost pre-bull market post-COVID crash levels. Although the HODLers’ position began to deplete around month and a half ago, it’s still in healthy area and not yet reached peak distribution which indicates for a nearing macro top.
Another thing I’d like to give emphasis is the transfer volume transacted on-chain by size. If large transactions sizes are dominating the volume it means that there is probably an interest from high net worth individuals, trading desks and institutions.
Moreover, it suggests that the maturation of Bitcoin is increasing, and it’s becoming more widely acceptable as an investment.

In the chart above we can see the parabolic increase in volumes by sizes of 100k - 10M plus, this began since mid-September probably because investors reached a conclusion that Bitcoin is not planning to trend back down and the opportunity to buy cheaper coins is evaporating. Thus, they made a decision to flow money into Bitcoin.
More than that, we can see transaction sizes of 100k - 10M are continuing to increase, while 10M plus transactions are trending down. Not something I’d be worried about due to the elevated levels of the three clusters.
Kissing Point
We're just hitting what I call the “kissing point”, let’s look Long and Short-Term Holder Supply in Profit/Loss metric to grasp what is that and how it adds to the broader macro picture.

The “kissing point” is when the supply in profit of LTH has reached a new ATH and it touches the supply in profit of STH. When it occurs, LTH supply in profit is returning to decrease; LTH selling coins. And on the other hand, the supply of STH in profit is increasing.
As the chart above shows, this phenomenon historically indicated the beginning of a macro uptrend.
We’re currently at a pre-bull run stages, most market participants around are HODLers who managed to absorb the volatility and downtrend price movements.
It means that the masses have not yet entered the market, the interest in Bitcoin was very quiet so far. And is just now, after breaking to a new ATH returning, and with it retail investors, FOMO & macro top.

Looking at Entities Net Growth we can see that the growth of new entities is at very low levels, relative to history it’s at pre-bull market levels. This confirms the thesis above, retail investors are not here, we’re just at the beginning of a new macro uptrend.
So far we’ve understood that we’re at the beginning of a macro uptrend, but this doesn’t mean a short-term downtrends are not possible. Noting this because the leverage in the market is pretty extended.
We’ve got futures funding rates at 0.045%, a surely elevated level. This means that the majority of perpetual contracts are long and traders are paying high interest rates for taking leveraged long positions.

This comes along with perpetual futures open interest at all time highs, which suggests increased probability of a volatile leverage squeeze occurring.

The above information most be considered, short-term we might see a leverage wipe-off along with a long squeeze which will leave place for a healthy spot price price increase.
I’ll round up this letter with Entity-Adjusted NUPL. I will start off by saying that Bitcoin’s most massive and rapid uptrends have been in the range between 0.5 - to 0.75.

In a more focused view, we can compare the last time we came from an uptrend to the current level of the metric, which is 0.64. At the range from 0.64 to 0.75 area, price x2.6 itself (from 24k to 64k).

The metric’s value currently is 0.64 while price is 65k, until it’ll reach to 0.75 level price supposed to, more or less, double itself. This will put us at price of around 120k - 130k, which might be the next macro top.
Conclusions
All the above indications are signaling that we’re at the beginning of another macro uptrend. Macro-wise I do expect a several interesting months price-wise, with price reaching new ATHs and might get exhausted around the 100k plus area. Short-term I’d be cautious due to the massive leverage in the market, most be noted that it doesn’t mean we’re entering another bear period. BUT, in the upcoming weeks we’ll probably see a leverage wipe-out which will bring price down in the short-term.
Links and References
Newsletter Archives: Dor’s On-chain Newsletter
Data Sources: Glassnode (T3 paid subscription), checkonchain.com
Disclaimer
Nothing written in this newsletter is to be considered as an investment / trading advice, do your own research.
If you found this letter helpful and informative I’d appreciate your subscribe and share, this way I will be able to reach more people.