

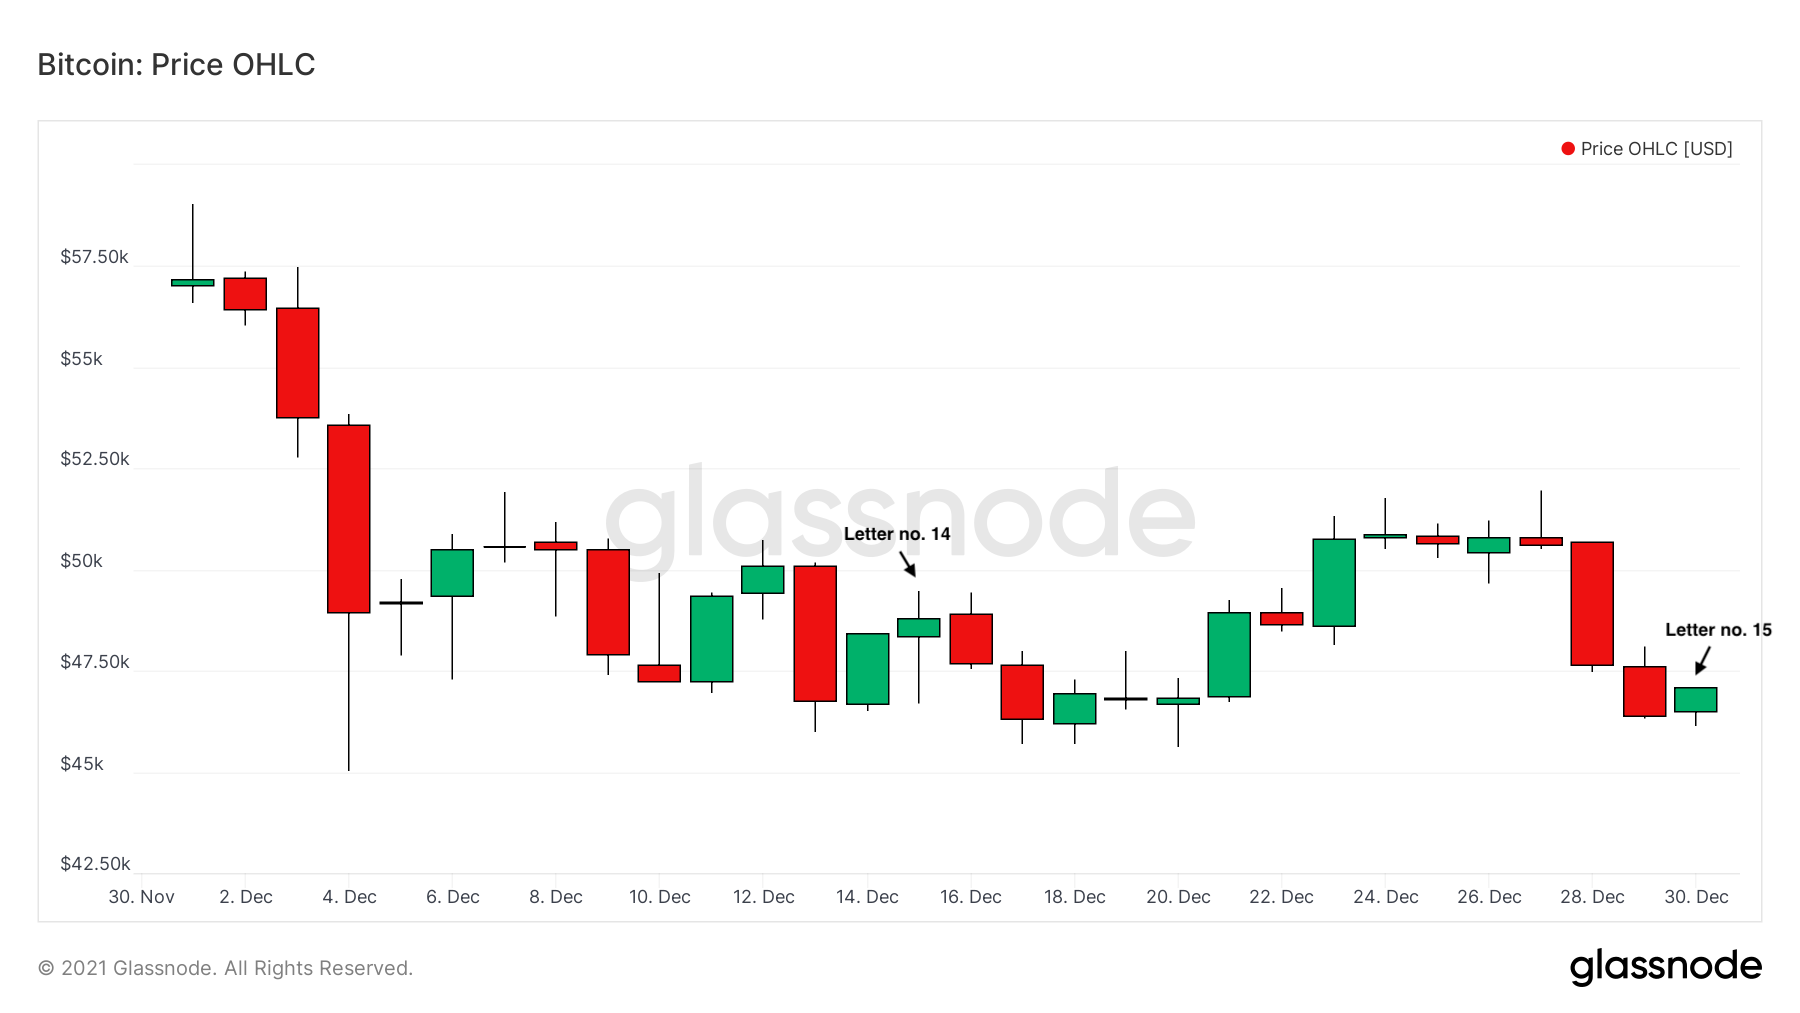
Letter no. 15: Volatile but steady

Date: 30/12/2021 BTC Price: 47k
Hey Subscribers,
Welcome to letter no.15 of Dor’s On-Chain Analysis newsletter.
In my last letters I’ve outlined that an another accumulation period is likely upon us. Since then, price has managed to reach the 52k and trend back in the last days down to 47k.
As always, in this letter I’ll assess what effects price action of the last two weeks has on on-chain fundamentals.
Analysis Breakdown
I’ll start off with LTH SOPR, which is the ratio between price sold / price paid of spent outputs of at least 155 days. Long-term holders, as we know, are experienced market participants. Their spending behavior can tell us a lot about the direction of price and the overall market sentiment.
We can see that along with price decrease, LTH SOPR has decreased too. This means that LTH are not willing to sell coins and exit the market. They’re not bothered from the downtrend of the last two months.

This phenomenon suggests that HODLing sentiment of important market participants is staying strong, probably because of knowing that higher price will arrive in the coming months.
At times like this it’s impossible to not include LTH Supply in the analysis. We can see a slight uptrend in the supply held by LTH. This may indicate that another period of accumulation is occurring which will be followed by macro uptrend.

Since the 27th of December we have has seen a significant decrease in price. From almost 52k down to current prices of 47k, is was caused by long liquidations. An accumulated sum of 72.5 million dollars of long positions were liquidated.

Let’s take a look at OTC desks holdings, large buyers are associated with buying Over The Counter. Doing so because they’re buying large quantities and want to avoid slippage and being front-run by smaller traders / investors.
Therefore, the rational is that a declining OTC desks supply suggests that the demand by larger buyers is exceeding the available supply in the OTC desks. From this can derive that big players are taking advantage of the last two months downtrend to accumulate more coins.

To assess what are our support & resistance areas I’ll bring up URPD, which shows at which price a current set of UXTOs were created. Simply, each bar shows the amount of existing bitcoins that last moved within that specified price.
Look at this metric we can see that we’re currently at a price where 3.36 percent of supply moved at. According to the chart we can see a distribution to three relevant clusters.
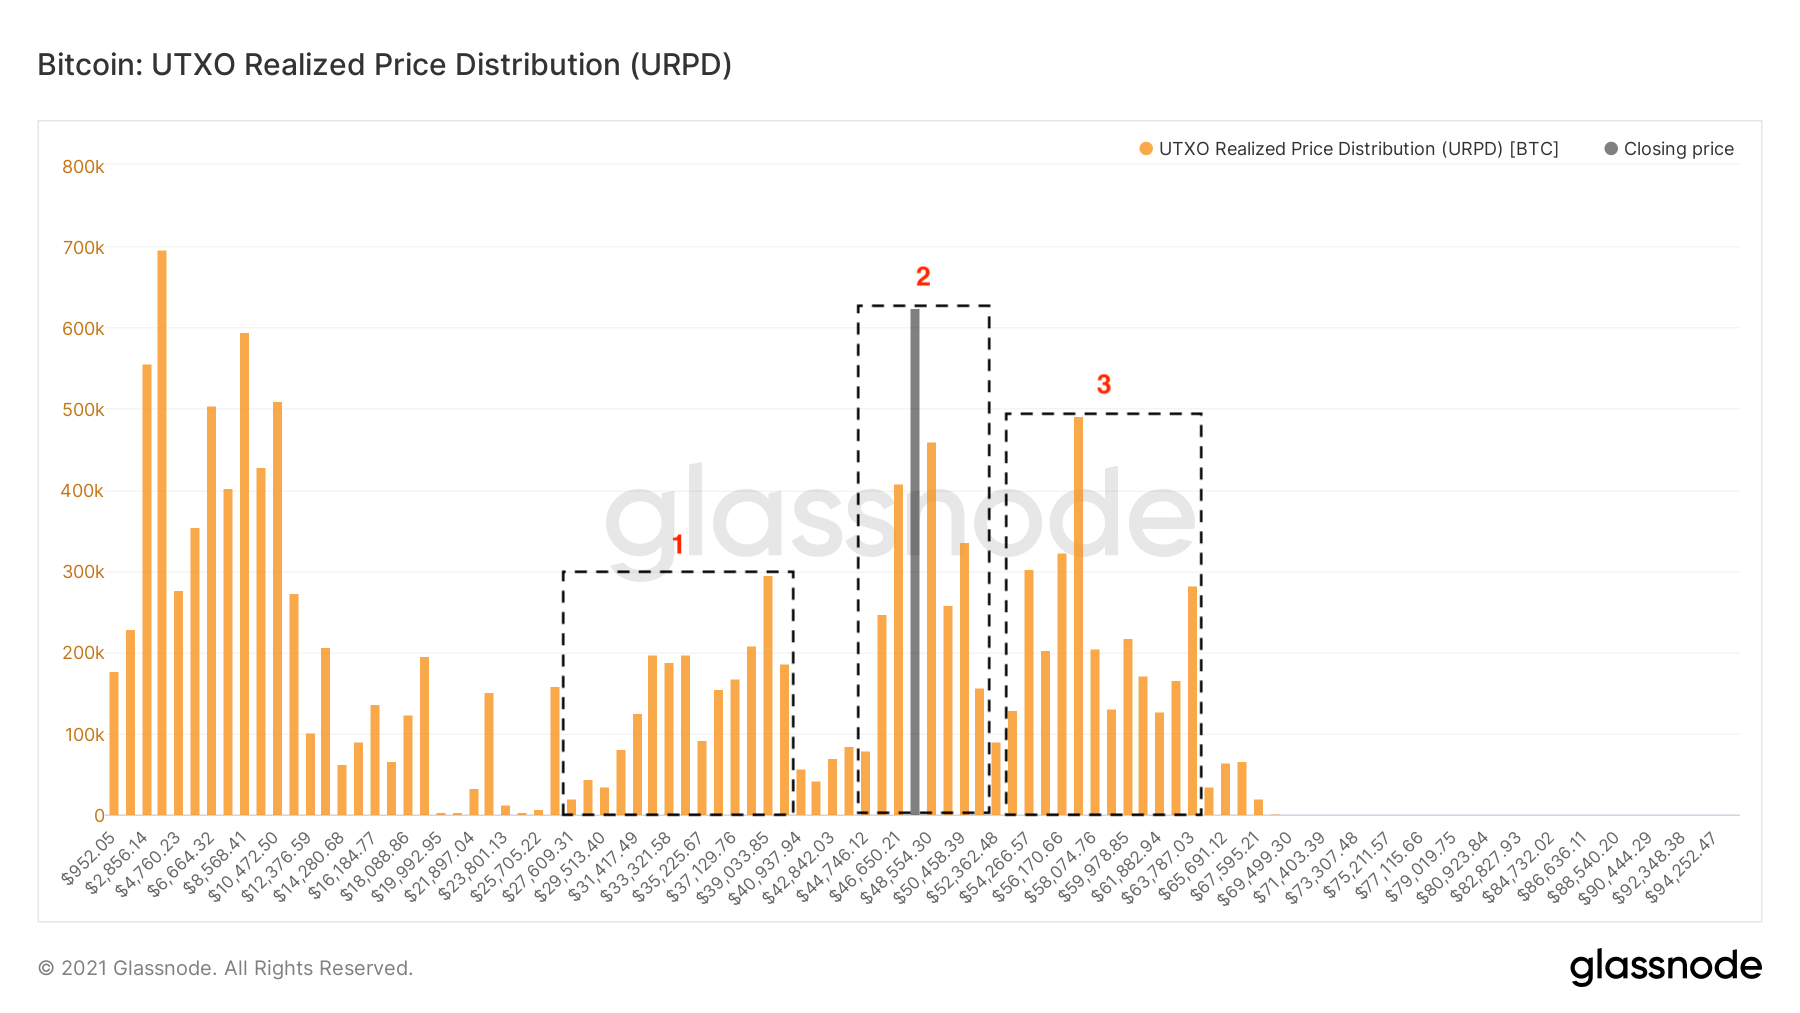
Cluster no. 1 ( 30k - 39k ) seems to be the next support area, and cluster no. 3 ( 53k - 63k ) seems to be the next large resistance area.
We’re currently at cluster no. 2, where we’ve got 48k - 50k the next main resistance area for the short-term.
I’ll close off with a macro metric, called Supply Delta, which is the difference between STH Supply and LTH Supply. This is an effective metric to identify macro tops.
We can see that a top in the metric brings an indication of a macro top. But looking at the difference between STHS & LTHS, we can clearly say that there is a macro uptrend ahead of us.

Conclusions
Although we’ve seen an indecisive & volatile price action in the last two weeks. On-chain data remains pretty strong. LTH are not increasing spending, hodling coins and even increasing buying despite the downtrend. OTC desks balances declining and indicating that large buyers are stepping in the market. The supply difference between STHS & LTHS is indicative of an upcoming macro uptrend.
According to the indications above, I still remain bullish for the coming months. Although it’s not easy on times like this, keep a long term look.
Links and References
Newsletter Archives: Dor’s On-chain Newsletter
Data Sources: Glassnode (T3 paid subscription)
Disclaimer
Nothing written in this newsletter is to be considered as an investment / trading advice, do your own research.
If you found this letter helpful and informative I’d appreciate your subscribe and share, this way I will be able to reach more people.