

Letter no. 12: Sideways & stable

Date: 25/11/2021 BTC’s Price: 59k
Hey Subscribers,
Welcome to letter no. 12 of Dor’s On-chain Analysis Newsletter.
In my last letter I have elaborated on a few on-chain categories; spending behavior, derivatives markets and the overall macro picture. Since then BTC’s price has ranged between the 60k down to 55.5k area, which from there has raised to the current price of 59k.

In this letter I’d put an emphasis on short-term market participants, which are more sensitive to price movements and have the ability to affect price in the short-term. Along with covering several different on-chain categories.
Key Takeaways
STH-SOPR suggesting stabilization of price and a probability of returning to uptrend.
LTH spending & coins lifespan are healthy and indicating early stages of a macro uptrend.
Supply dynamics seems positive and suggesting higher prices in the months ahead.
Short-Term Holders
I’ll start this letter with STH-SOPR, which I’ve touched in the previous letter.
Firstly, we can see that in the last couple of days we got rejected from level 1, which is the breakeven point. It means that once STH reached breakeven they decided to sell their coins. Not willing to believe in a short-term uptrend.

On the other hand, we can see the metric trending up, which means less STH are willing to sell coins in loss. This phenomenon is in some way similar to the lows of Sep, where we climbed back from 41k up to the low-mid 60k.
Diving into a more granular view of the metric, I’ll take the 24h MA. We can clearly see the bullish divergence that occurred in the last weeks.

Once again, similar to the lows of Sep, STH-SOPR has trended up while price has trended down / consolidated. The meaning of this is that while price is decreasing = show of weakness, less STH are willing to realize losses = show of strength.
Moreover, in the last couple of days the metric broke above level 1. Lower timeframes are used to give us the earliest indication of a market structure shift, and we just got one.
From here, we’d want to see STH-SOPR on the daily breaking too, and being supported by the level 1. This will suggest a bullish price action in the short-term, which might return price to a longer uptrend trajectory.
Continuing with STH, bringing up a more macro metric; STH Supply. Which is the antithesis of LTH Supply a metric that have been mentioned a few times in previous letters.
If LTH are distributing coins into market strength, STH are the ones that accumulating those coins. So, if LTH beginning of distribution is suggesting macro uptrend, then STH beginning of accumulating is suggesting macro uptrend.

There is a long way until STH will reach their peak accumulation that will suggest the next macro top. Therefore, macro-wise it’s a positive indication.
Long-Term Holders Spending
The next category is LTH spending behavior, looking at LTH supply in profit. We can see a gradual decrease, this means that LTH are realizing profits in a moderate way. Keep in mind that his behavior is typical to early stages of macro up trend.

Although LTH are spending, they’re doing so in minimal levels. And this is what we want to see in the early stages of macro uptrend. LTH distributing coins in an accelerating levels at this early point would suggest that they’re looking to exit the market due to disbelief of higher prices.
Looking at lifespan category can complete the picture relating to LTH profit-taking.
Lifespan
Starting off with entity-adjusted Dormancy, which describes the average number of days that each spent coin had remained dormant before it was moved.
It is still at relatively low levels, which means that coins with low days are being spent. The rational is that LTH are holding coins for long time, therefore holding ‘older’ coins. Low values of the metric suggesting that the coins being spent are relatively young.

Another metric which provides the same indication is Spent Volume Age Bands, we see still relatively low levels of spending of coins with long lifespans.
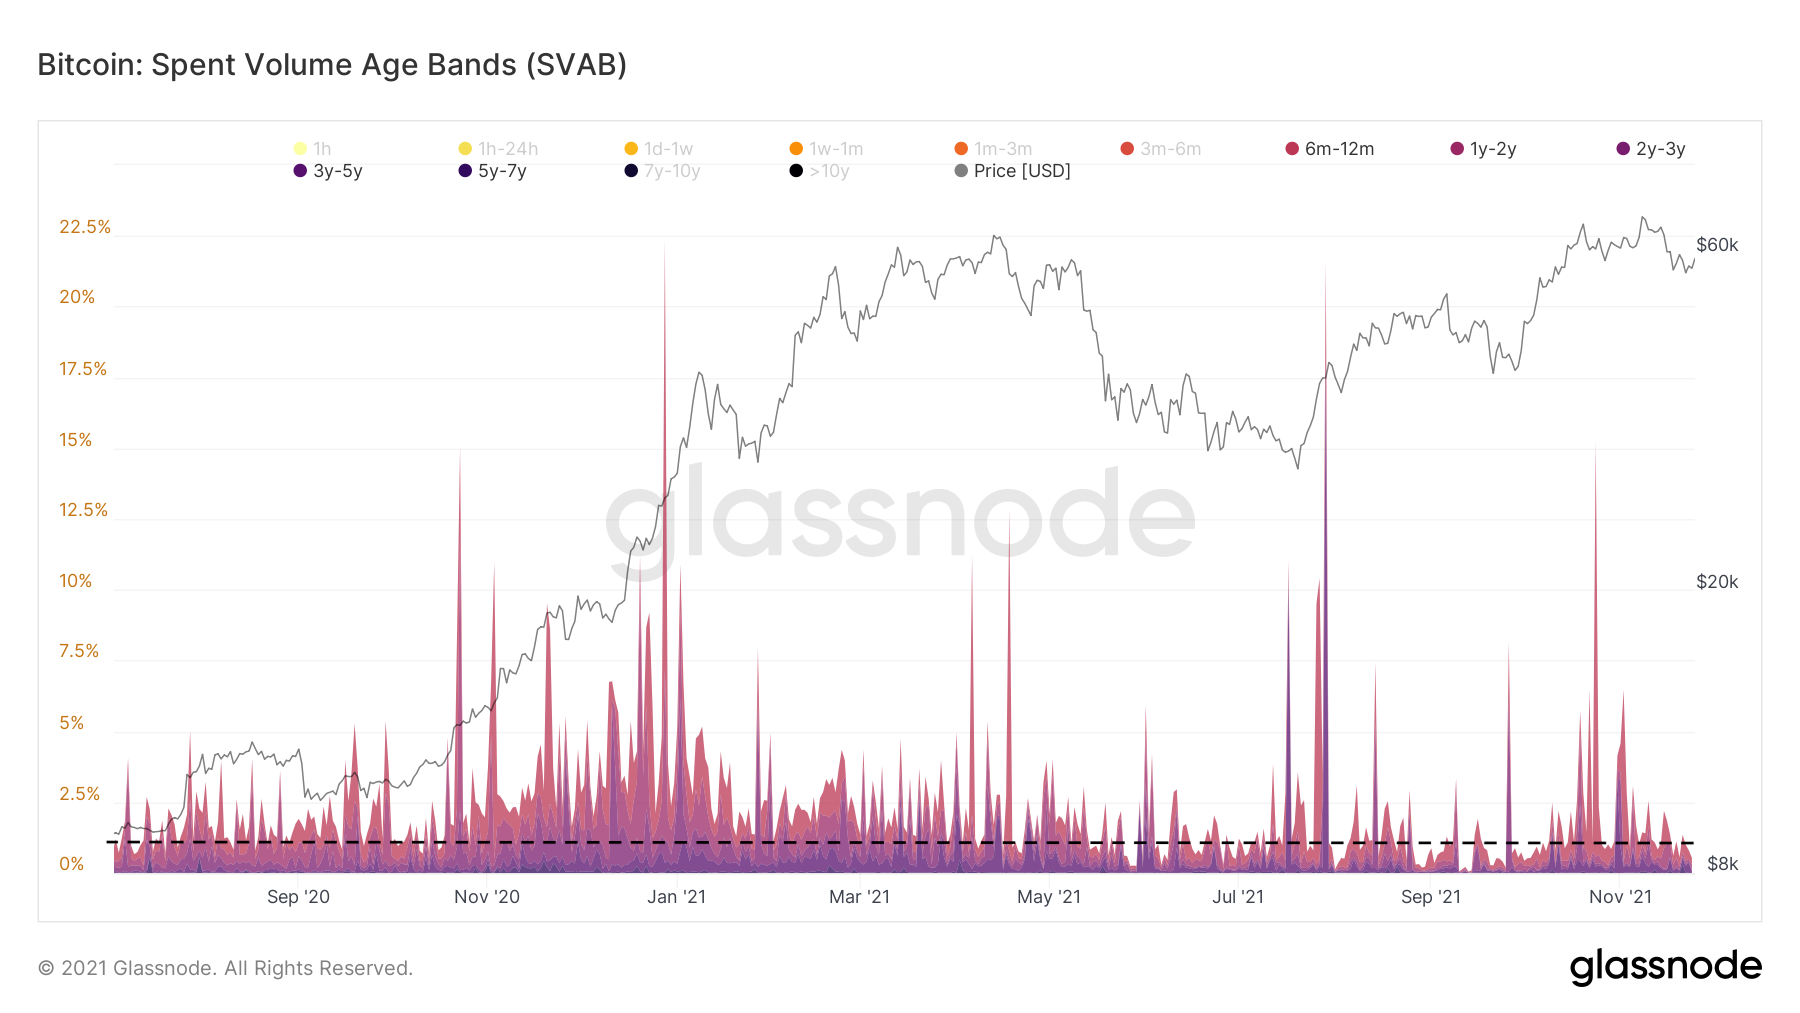
So, at these early stages of a macro uptrend minimal spending from LTH confirmed by lifespan metrics is a positive sign, suggesting that LTH are still not rushing to distribute their coins due to expectation of higher prices.
Supply Dynamics
For this category I’ll share a metric called Illiquid Supply Position Change, which is the 30d net change of supply held by illiquid entities. To make it clear; illiquid entities are entities that spend less than 25% of the supply they hold.

A few things to note;
Is that supply has continued to move to illiquid entities and currently the supply held by them has reached it’s all-time-highs.
Is that we’re still far away from peak distribution of coins by these entities, which is indicative of continued downtrend and upcoming bottom.
Is that we’re not close to the point where these entities start to distribute their coins, which is indicative of a macro top.
All these indications are providing a healthy and positive picture about supply and the macro picture.
Conclusions
Although we’ve seen sideways price action in the last week, on-chain data is still stable and providing a positive & healthy picture for the months ahead. As I’ve mentioned, I believe that this cycle will break the traditional 4-year cycle which ends around Nov-Dec historically. That's because we have several months of higher price action ahead of us.
Links and References
Newsletter Archives: Dor’s On-chain Newsletter
Data Sources: Glassnode (T3 paid subscription)
Disclaimer
Nothing written in this newsletter is to be considered as an investment / trading advice, do your own research.
If you found this letter helpful and informative I’d appreciate your subscribe and share, this way I will be able to reach more people.