

Above 50k

Hey guys, I’m starting off my first on-chain market analysis analyzing the previous two weeks of on-chain data, what we can conclude and where we are likely heading.
So let’s dive in!
In the last couple of weeks price have been ranging from 49.4k-51.7k, a solid consolidation with a break above 50k in the last few days. BTC managing to break above is a healthy sign; we’re seeing an affect of market participants willing to absorb sold coins and sustain high prices along with supply shortage, both are beneficial for higher prices.

Exchange Flows
First of all, I’d like to take a look at exchange flows.
Since the end of the capitulation around 20th of July, we have seen an accelerated outflows of BTC off exchanges.
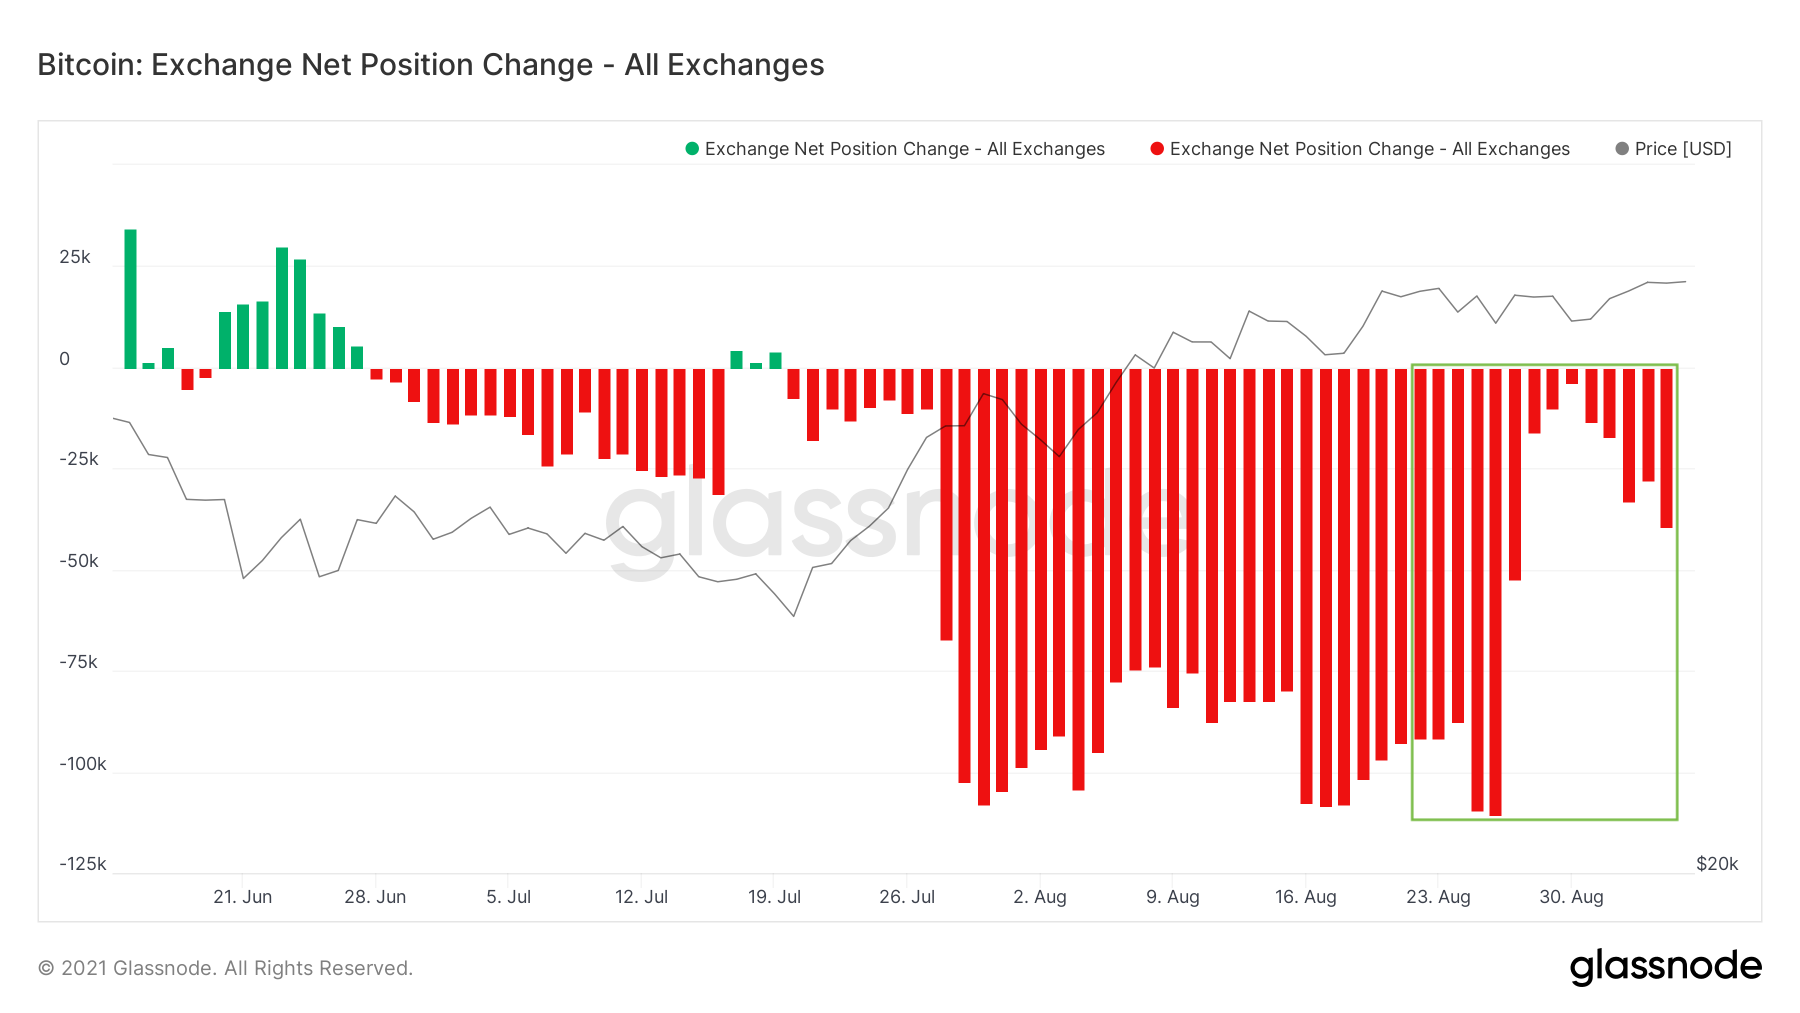
In the last two weeks specifically we saw outflows at rates not seen since Nov 2020 (the beginning of the bull run).

A continuation of outflows off exchanges along with price increase is a positive sign, market participants are not falling for the incentive to sell BTC for higher prices and have the conviction to HODL.
Moreover we can see that exchange outflows has decreased in the past week, I’d wouldn’t take it as a bearish sign as far as we don’t go back into a high levels of exchange inflows which indicates for market participants tending to sell coins.
Exchange Flows - Bullish.
Secondly, we can see exchange outflows reflected in the Exchange Balance metric, hitting a periodically all-time-low. Diving below the level seen in the last all-time-highs at May.

Although exchange balances went up during the last capitulation event, they’re back decreasing along with price moving up. Once again, this is a healthy sign; market participants aren’t willing to part with their BTC due to high prices.
Exchange flows - bullish.
Spending Behaviour
Let’s start off with Liveliness which is the ratio between Coin Days Destroyed and the sum of all coin days ever created.
Liveliness is likely to increase while long term holders who hold old coins with many coins days are distributing coins. And vise versa, liveliness will decrease while long term holders will decrease spending and, or accumulate.

*Note that the spike in liveliness is probably due to an internal transaction of exchanges re-balancing coins*
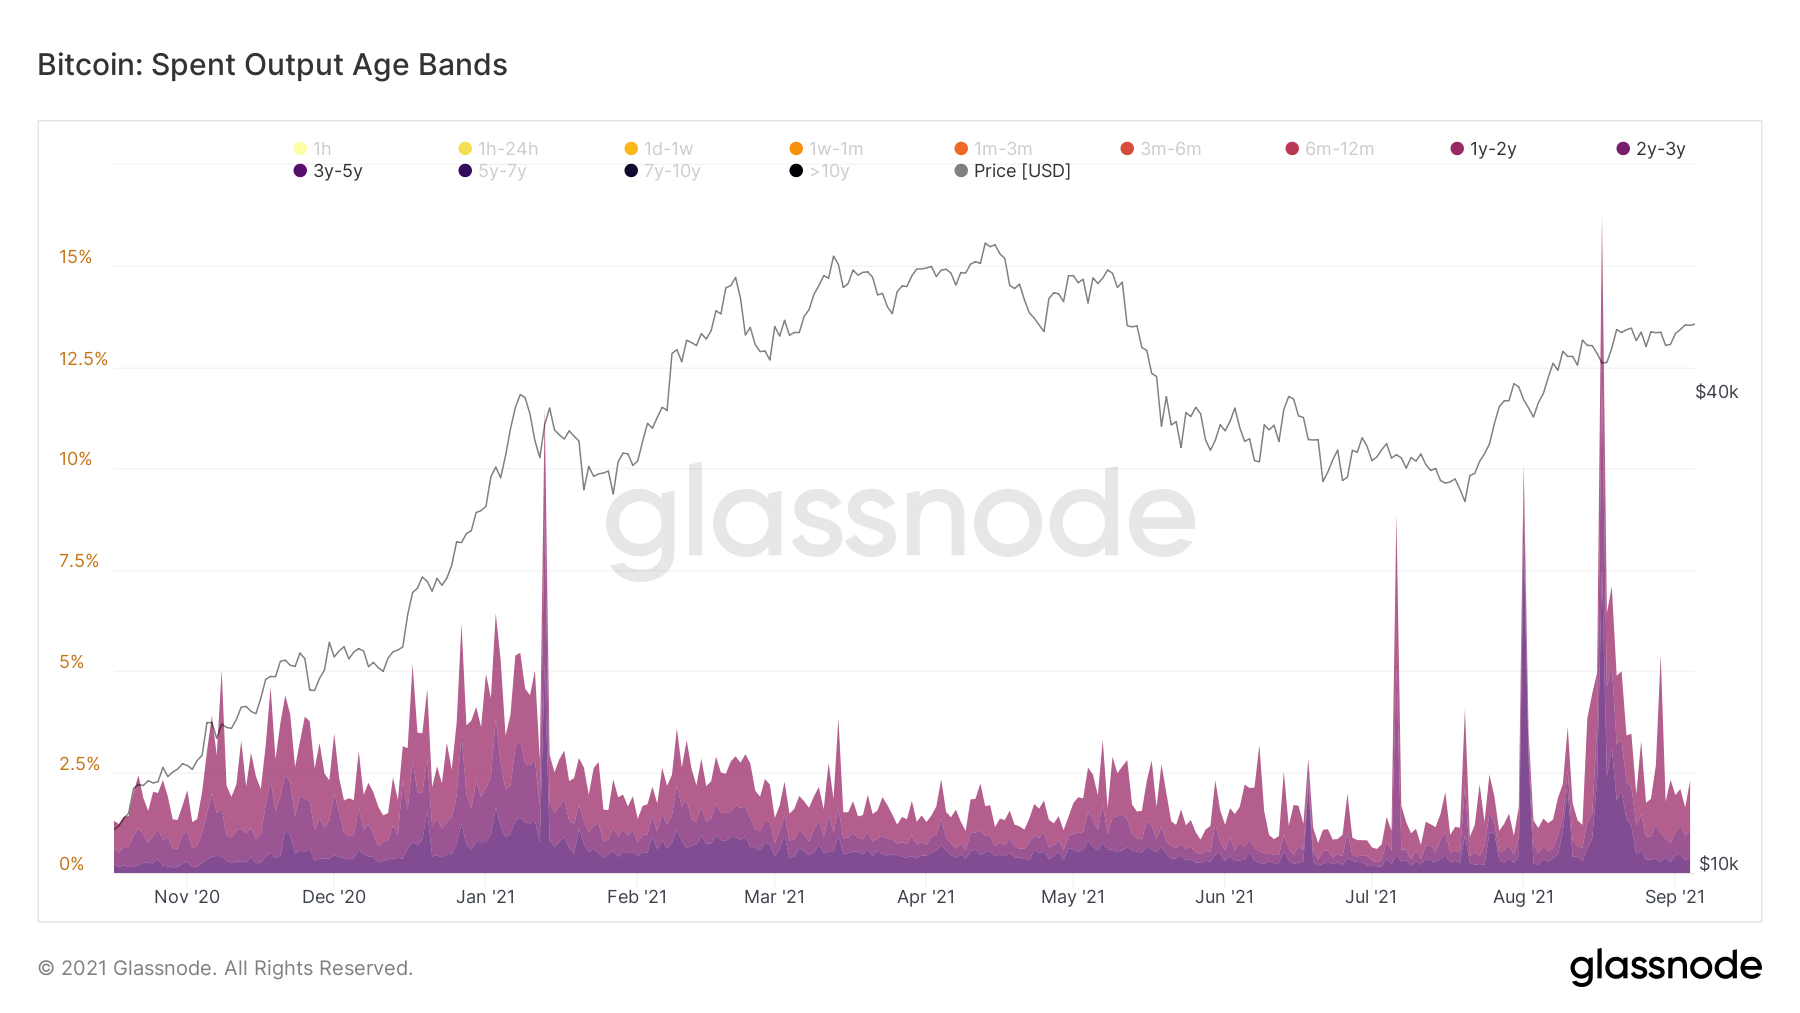
Secondly, let’s look at Spent Output Age Bands metric.
We can see selling coming mainly from 6m-12m cohort, at levels actually higher than levels of the beginning of the bull run of the May sell-off.

Due to the fact that the spending has decrease along with price increase I’d say it's a natural indication.
Looking at the older cohorts we can see that their spending is minimal, the only uptrend in spending is due the internal transaction which caused a spike that right away have decreased back to normal levels. Current spending is not close to the spending seen at the beginning of the bull run. Long term holders haven’t started to take profits yet and they’re first ones to do so.
So, as far as they’re still HODLing we’re in a positive zone for price increase.
Last chart for this section is Bitcoin long-term SOPR family by Tsypruyan.
Long-term holders, which are defined as spent outputs with lifespan of at least 155 days.
We can see clearly that they’ve been spending since the beginning of the bull run, slowed spending near the top and decreased it massively during and after May capitulation event.
When BTC started to climb up after the sell-off their spending seems quiet dormant and is more likely decreasing.

Spending Behavior - Bullish.
Supply Dynamics & Coin Maturation
Lastly, I want to touch on two more sections.
HODL Waves, a coin maturation related metric shows us that coins which have been bought 3m-6m ago are getting matured into the 6m-12m cohort. This signals for a healthy HODLing sentiment.

Long-term circulating supply in profit, a supply dynamic related metric is showing us an increase in long-term holders supply in profit. Mostly when the metric crossed above the 0.75 level BTC saw a macro uptrend.
Moreover, long-term supply in profit have been kind of a ceiling, once it reached 0.83-0.84 levels long-term holders started to realize profits, but it takes time until their profit taking affects price to the downside.

Currently, 79% of long-term holders supply is in profit, we’re not far from 83-84 percent. Once we’re reaching the eighties it’ll be a good indication that a run up is coming, which long-term holders will realize profits into.
As for now, we’d want to see a raising proportion of long-term supply in profit along with price raising.
Coin maturation & Supply Dynamics - Bullish
Conclusions
On-chain data seems healthy as of now, in my opinion we’re likely to head higher. Note that a short correction is more than possible due to the rapid run up of the last two months.
Disclaimer
Nothing written in this newsletter is to be considered as an investment / trading advice, do your own research.
If you found this post helpful and informative I’d appreciate your subscribe and share, this way I’ll be able to reach more people, thanks in advance!